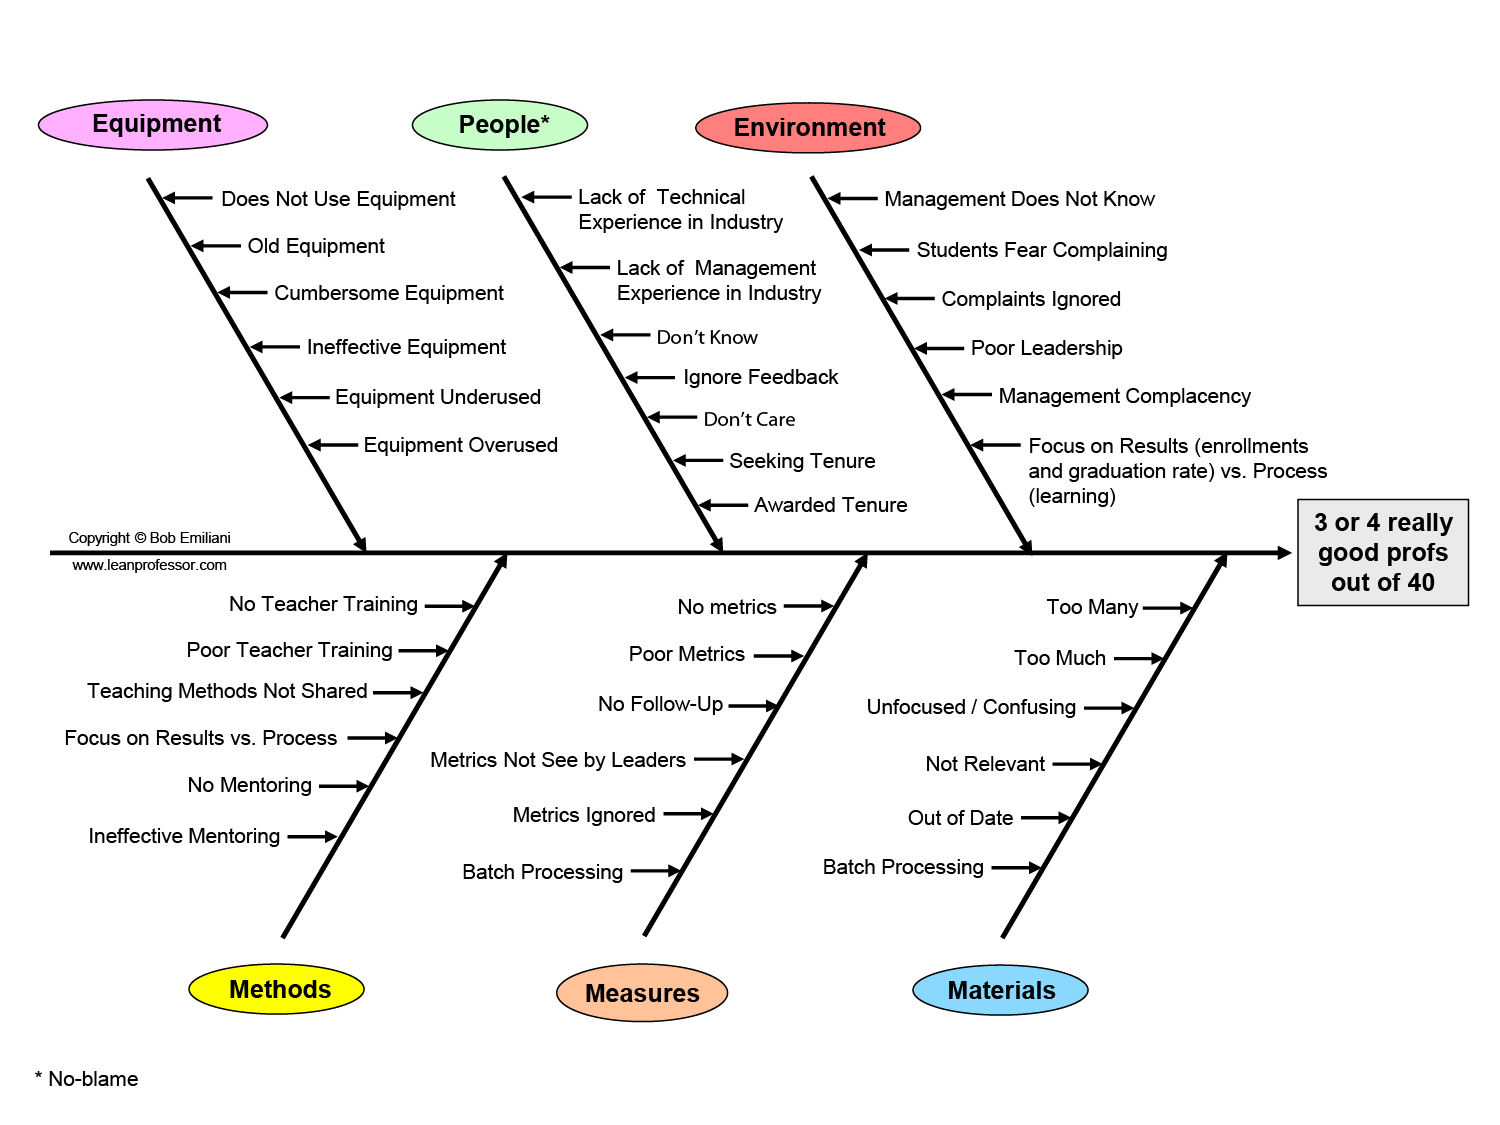
Have you ever said or heard other people say that they had only 3 or 4 really good professors when they were an undergraduate student, out of the 40 or so professors they experienced over four years? Why are only 10 percent of professors remembered by students as having been really good? I have heard this repeatedly from many people over the years, including my children, and I experienced it myself as an undergraduate. And this seems to be a global phenomenon. Has this been your experience as well?
A service that requires 40 points of contact for weeks at a time and results in only 10 percent satisfaction is in dire need of rapid improvement. What is causing this problem? Below is an Ishikawa diagram that I created showing some of the possible secondary causes that contribute to the observed effect. While more work is needed to identify tertiary, quaternary, etc., causes, this diagram is a start towards developing a better understanding of the problem.
Lean Teaching and Lean University seek to reverse this outcome so that students experience 36 or 37 good professors out of 40. But, I need your help generating data to identify process problems. Please take one minute to fill out the form below to identify the top drivers of the observed effect for each of the six cause categories, from your perspective as a current student or graduate. The more people that participate, the sooner I can share the results with you.

