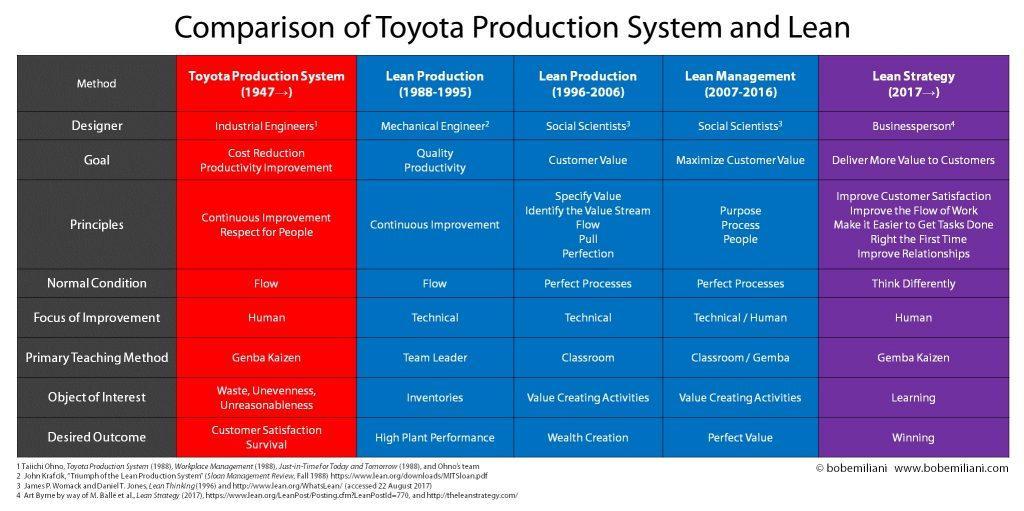
I recently posted a truncated version of the graphic below with caption: “Not perfect, but close. It’s about right.” The response was overwhelmingly positive. A great majority of people recognized it as a unique comparison, one that they had never seen before, and also an accurate comparison that effectively captures differences that actually exist (click on image to enlarge).
My intent in producing the graphic was to address the decades-long confusion that has existed between TPS and Lean, and to help people understand the critical differences. It was also to help people realize why they are often unable to achieve much success with Lean despite a lot of effort over many years.
The graphic presents factual differences and also shows how the interpretation of TPS by university researchers changed over time. My aim is to help people recognize how these differences shape the results that they achieve and the impact on people (particularly employees, as well as suppliers, customers, investors, and communities).
Nearly 30 years ago, Lean was presented as the generic version of TPS. Actually, Lean was an interpretation of TPS – a rather poor interpretation. Then, over time, Lean drifted farther away from TPS, thus making it far less of a generic version of TPS and more its own unique thing. In other words, the interpretation of TPS got worse over time instead of better. It is clear that TPS and Lean are not the same. The differences between the two are many and significant – especially in the details.
But, if “Lean” is meant to be the generic version of TPS, then Lean is obviously best represented by the red column, TPS, not the blue columns. In other words, if Lean is truly the generic version of TPS, then the ingredients should be nearly identical – but they are not.
The graphic does not argue against Lean success or the useful learning that will come from it. It merely points out important differences between TPS and Lean. Understanding these differences can, in turn, help people re-focus their attention back towards TPS and The Toyota Way (“Continuous Improvement” and “Respect for People”).
The graphic above is a high resolution image that you can copy (click on image to enlarge and save). Click here to download a print-quality .pdf file of the graphic. You can use the graphic to reflect on your own understanding of TPS and Lean; in your training and teaching of TPS or Lean; or to stimulate discussion and deepen the understanding of TPS and Lean in your organization and between you and your suppliers. Perhaps it will result in needed corrections that help put you on a path closer to Toyota’s management practices so that you can achieve better business results and better outcomes for people.
The graphic includes several questions for you to contemplate.
- Why are there differences between TPS and Lean?
- Why did Lean drift farther away from TPS over time?
- How do the differences affect outcomes?
- What is the impact on business results and on people?
- What should you do if your Lean efforts don’t produce significant business results? Should you move towards TPS?
- In what ways does the graphic reduce confusion between TPS and Lean?
- Toyota does not practice Lean. Why?
- TPS represents actual business needs that are common among most businesses, while Lean does not necessarily reflect actual business needs (for example: Maximize Customer Value, Perfect Processes, and Perfect Value). Does Lean reflect your actual business needs?
Can you think of other questions?
And finally, I’d like to leave you with a thought to ponder: Anyone can know Lean, but nobody can know TPS.

