One of the difficulties with so-called “Lean transformation” is that there is no standard process that CEOs can follow for executing a Lean transformation. This surely has had an impact on organizations’ ability to transition from classical management to progressive Lean management. Additionally, a preconception was established long ago by top Lean promoters that every company and every situation is unique. That subverted the idea that Lean transformation could be standardized.
But, as it turns out, things are not so different from one company to another, regardless of industry, and thus the Lean transformation process can be standardized. Anyone with a lot of kaizen consulting experience will tell you this. The goal of a Lean transformation is to get people to think and do things differently, regardless of if it is a hospital, bank, law firm, or a manufacturer of semiconductors, aerospace parts, or medical devices.
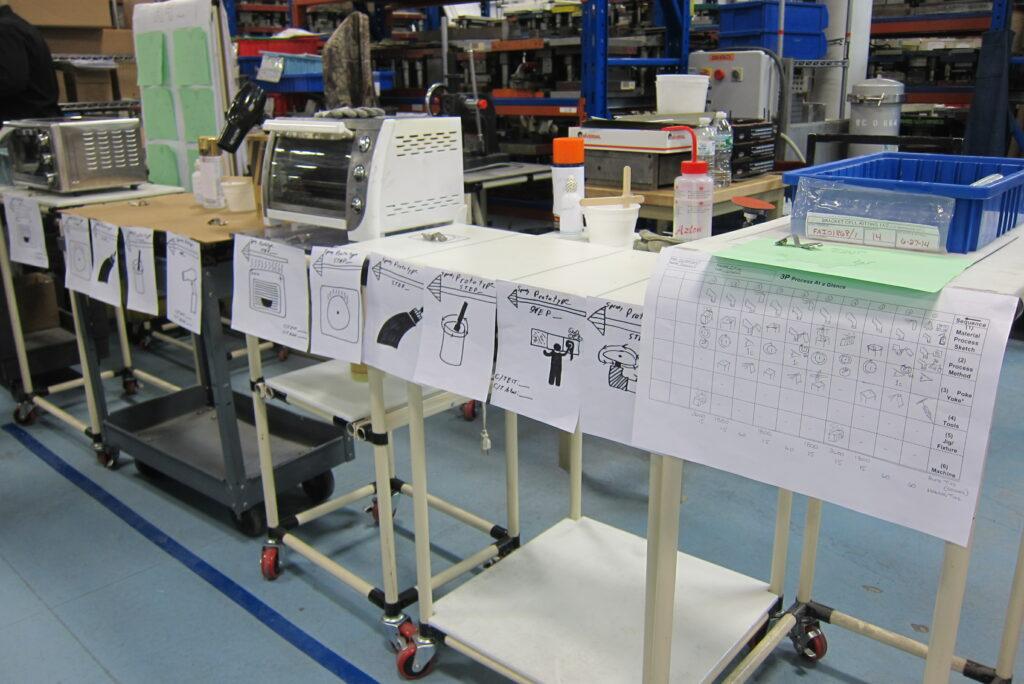
The image below, on the right side, shows a Process-at-a-Glance chart for a manufacturing process. I had the idea in the spring of 2016 of repurposing Process-at-a-Glance charts for describing the process that CEOs must engage in to lead a Lean transformation.

For four years, in my graduate Lean Leadership course (TM572), I gave students an assignment to read two books about Lean transformation by practitioners who has successfully done it. The next step was to convert the Lean transformation processes described in each book — word instructions — into Process-at-a-Glance charts. This chart uses pictures instead of words to create a description of the process. What the students produced was remarkable!
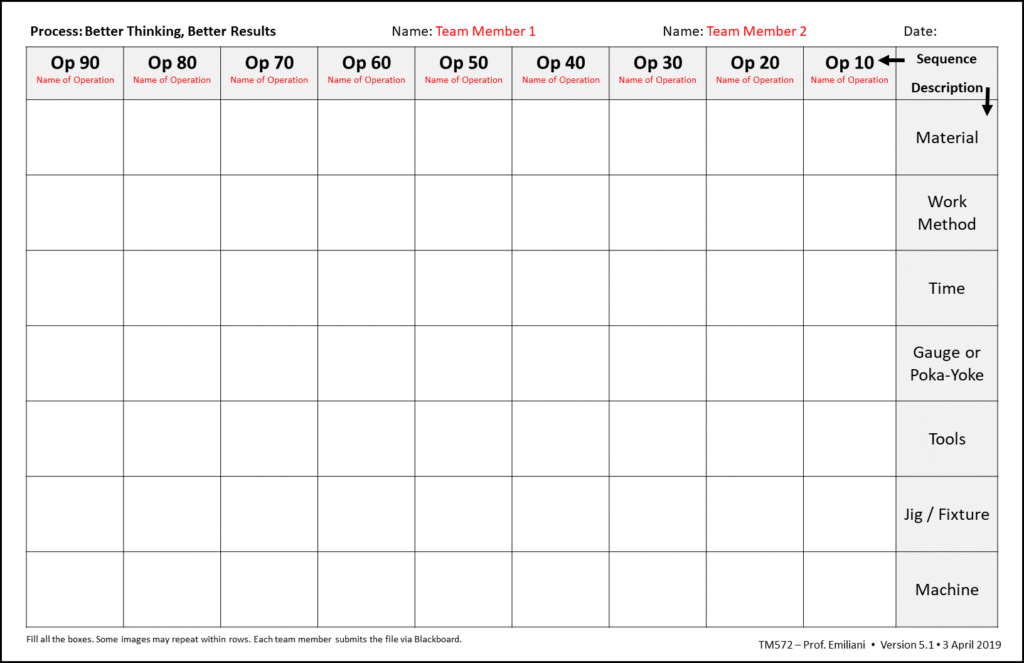
I decided to use the same format used for creating Process-at-a-Glance charts for manufacturing processes, as shown below. I gave students detailed instructions on how to complete the Process-at-a-Glance chart assignment for Lean transformation. This included various analogies and examples for the descriptions listed in the right-hand column: material, work method, time, gauge or poka-yoke, etc.

As you can imagine, it was a very challenging assignment for students, who worked in pairs to complete the chart. Most students struggled to translate word instruction into visual instructions. But some students took on this challenge and produced remarkable Process-at-a-Glance charts.
Perhaps you are interested in trying to do this too. You can use the above chart and the book Better Thinking, Better Results as the Lean transformation process to create your own Process-at-a-Glance chart. You can approach this challenging assignment in two ways:
- As an intellectual exercise to satisfy your curiosity and sharpen your understanding of what CEOs must do to undertake a Lean transformation.
- As a practical problem to solve as part of your Lean transformation efforts — either at the start or during if things are not going so well.
Similar to hoshin kanri (policy deployment), the CEOs Process-at-a-Glance chart can be cascaded to lower levels of the organization by creating visual descriptions of what managers at lower levels must do to support the CEOs Lean transformation Process-at-a-Glance chart. This aligns the entire management team so they can move forward together to achieve the desired outcome.
If you wish, I can work with you or your leadership team to do this as part of your company’s Lean training for senior managers. Let me know if you want to do this. It will be fun and useful!
In you like my idea and use it, please credit the source. Thanks.
